No audio available for this content.
Real-time single-frequency precise point positioning for cars and trains
By Peter de Bakker and Christian Tiberius

with Richard Langley
“IT’S GETTING BETTER ALL THE TIME.” This refrain from the Beatle’s song could well describe precise point positioning or PPP. PPP is a positioning technique that relies on GNSS carrier-phase measurements (in addition to code or pseudorange measurements) from a user’s receiver along with satellite orbit and clock data much more precise (and accurate) than that included in broadcast satellite navigation messages to achieve accuracies down to the centimeter level. It also requires a more sophisticated model of the measurements compared to that used in most consumer GNSS equipment and even some professional devices, including accounting for residual tropospheric propagation delay, carrier-phase windup, and even solid Earth tides.
PPP has been around for more than a decade and ongoing research has gradually improved its capabilities. Until recently, it has been used primarily with dual-frequency GPS observables. However, the technique is not restricted to GPS. It works equally well with observables from other constellations including GLONASS, Galileo and BeiDou. As long as precise orbit and clock products are available (typically from the International GNSS Service or its participating analysis centers), then PPP positioning solutions are possible. And, single-frequency PPP is also possible. The primary advantage of dual-frequency PPP is that the ionospheric propagation delay is almost completely removed by linearly combining the measurements on the two frequencies, taking advantage of the dispersive nature of signal propagation through the ionosphere. But, if good predictions of the ionospheric delay at, say, the L1 GPS frequency are available, then it is possible to do single-frequency PPP. While not as accurate as dual-frequency PPP, the technique is considerably more accurate than typical pseudorange point positioning (the so-called Standard Positioning Service).
PPP is also traditionally a post-processing technique. That is, data is collected but it is not processed until some later convenient time when the necessary precise products are available. Such an approach is useful for many applications but clearly not for navigation, which requires real-time positioning. But in the past few years, a number of commercial and non-commercial entities have started streaming real-time satellite orbit and clock corrections over the Internet and various radio links, making real-time PPP a reality.
In this month’s Innovation column, we bring together, perhaps for the first time, single-frequency and real-time PPP. Our authors describe a series of experiments they have conducted on roadways and a railway achieving sub-meter horizontal positioning at a 95 percent confidence interval. Such accuracies may already be sufficient for freeway lane and railway track guidance. But we might expect even better accuracies in the future. After all, PPP is getting better all the time.
The single-frequency precise point positioning (SF-PPP) method, developed at Delft University of Technology, was previously demonstrated to provide lane-level position accuracy on a freeway in post-processing mode. Important applications of SF-PPP are lane-level traffic state estimation and lane-level specific driver advice for next-generation car navigation. For a functional system, as well as for advanced experiments in this field, the computed positions have to be available in real time. Therefore, a new real-time implementation of the SF-PPP method was developed as part of the Dutch Dynamic Lane Guidance project. In this article, we outline aspects of the real-time implementation, and we present experimental results from this new implementation collected on a busy freeway in the Netherlands and in a parking lot, as well as results from a railway experiment.
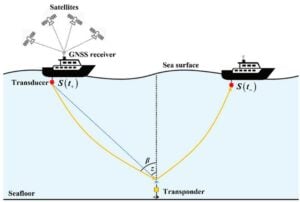
In these experiments, a test vehicle was equipped with a low-end, automotive-type single-frequency receiver with a patch antenna to collect raw GPS observations. A 3G mobile communications link was used to obtain data-correction streams over the Internet using the Ntrip protocol. The SF-PPP processing was performed on a laptop computer onboard the vehicle, in real time. Various forms of ground-truth positions were used to assess the real-time SF-PPP positioning accuracy. For some of our tests, the vehicle was also equipped with high-end GPS antennas and receivers to provide ground truth. The position solutions obtained with the SF-PPP algorithm have been compared to (post-processed) network-RTK solutions using the Netherlands Positioning Service (NETPOS). Additional validation was performed by means of a 5-centimeter-accuracy road-infrastructure map from Rijkswaterstaat, the Dutch Ministry of Infrastructure and the Environment, and by a centimeter-level a priori ground survey.
The new real-time SF-PPP software was tested successfully with performance comparable to our previous post-processing software, and meeting the required accuracy for freeway lane identification. Statistics on the performance are provided, as well as their dependence on a number of external parameters including the number of available satellites.
Precise corrections from both the German Aerospace Center (Deutsches Zentrum für Luft- und Raumfahrt or DLR) and the International GNSS Service (IGS) were used. Delays in the correction streams vary between providers and can increase further in the event of a time-out of the mobile link. The influence of these delays is considered, and an optimal approach for dealing with outages is discussed.
PPP Model and Corrections
The GNSS positioning model is non-linear. The observations are non-linear functions of the unknown parameters plus noise.
To solve for the unknown parameters (including the receiver position coordinates), through least squares estimation, the model must be linearized around an approximate solution.
In our SF-PPP model, the primary observations are, from each satellite, the pseudorange measurement and the carrier-phase measurement. The unknown parameters are the receiver position vector and the receiver clock offset, both of which are involved in the linearization, and also the ambiguity, associated with the carrier-phase measurement, for which the model is already linear.
In the context of PPP, it is important to note that in addition to the linearization around the initial approximate values, the computed observations contain a number of a priori model values for parameters which are not estimated, including:
- The precise satellite position and clock offset (including the relativistic effect): The GPS satellite positions and clock offsets are computed from the broadcast products (navigation message) and corrected with real-time data streams via Ntrip. The correction streams of DLR and IGS were used at different times as detailed in Table 1. In post-processing older files, the satellite orbits and clocks are taken from sp3 files, but to keep the processing as close as possible to the real-time functionality, these are first converted to corrections to the broadcast products.
- The (neutral) troposphere delay: The troposphere delay is modeled with the a priori Saastamoinen model using the Ifadis mapping function and parameters from the 1976 U.S. Standard Atmosphere.
- The ionosphere delay and satellite differential code bias: The ionosphere delay is computed a priori using the one-day predicted Global Ionosphere Maps (GIMs) from the Center for Orbit Determination in Europe (CODE), together with the corresponding differential code biases.
- The carrier-phase observations are corrected for the phase wind-up at the receiver and satellite. The user orientation is estimated from the vehicle velocity vector.

Besides the primary observations, the ambiguity estimate from the previous epoch can be added to the current epoch as an additional observation per satellite, because it is assumed to be constant in the absence of a cycle slip.
Observations from different epochs are assumed to be uncorrelated, and consequently the ambiguity estimates from previous epochs are uncorrelated to the current observations. Observations to different satellites are also assumed to be uncorrelated.
The carrier-phase ambiguities are the only parameters propagated from a previous epoch to the current epoch. The receiver position coordinates (and receiver clock offset) are estimated each epoch anew — no vehicle dynamics model is involved.
The computed positions are finally corrected for solid Earth tides with an efficient numerical model. Computed positions result in the International Terrestrial Reference Frame (ITRF) 2008 at the epoch of the observations.
In parallel with the positioning filter, statistical hypothesis testing is used to detect errors in the observations or propagated ambiguities (such as those caused by excessive multipath or a cycle slip), based on the detection, identification and adaptation (DIA) procedure. First, an overall model test is run at each epoch to test the validity of the model and observations. If the test is rejected, data snooping is applied to determine which observation is most likely to have caused the problem. If one of the pseudorange measurements is identified, it is removed from the model. If either a carrier-phase measurement or ambiguity is identified, the ambiguity for that satellite is reset; that is, the propagated ambiguity is removed.
Experiments
Four field tests that we have carried out are considered here.
- In October 2012, more than 100 laps were driven over a 5-kilometer stretch of the A13 freeway between Delft and Rotterdam. The data collected were reprocessed to validate the new real-time software implementation (but obviously carried out in post-processing mode).
- The first real-time tests were performed in December 2014 and later in May 2015 on the same stretch of the A13 freeway.
- In May 2015, a third dataset was collected on a recently constructed and nicely outlined parking lot in Delft.
- In July 2015, a train carriage was equipped with a GPS receiver and data were collected on a train trip from the center of The Netherlands to the far southern part — a distance of more than 200 kilometers.
Details of the four field tests are collected in Table 1.
Ground Truth
In our earlier experiments, the ground truth for the vehicle positions was computed with measurements from high-end equipment onboard the same vehicle. Both the antenna of the SF-PPP receiver and the high-end antennas were rigidly connected to a wooden beam on the roof rack of the van (positions of the two high-end antennas at both ends of the beam were obtained through network RTK GPS). As our results from this experiment show, the performance, and especially the precision, is very good, but a moderate bias of 17 centimeters in the cross-track direction was observed (see FIGURE 1 and TABLE 2). The suspect cause of this bias was the antenna location, close to the side of the vehicle and not attached to the metal roof itself.


Therefore, during more recent experiments, the test vehicle was only equipped with a patch antenna for the low-end, automotive-type GPS receiver, and attached directly to the roof of the car, in the middle of the centerline of the vehicle. In this case, the metal roof acts as a ground plane for the antenna, improving the gain and not acting as a source of multipath. However, this setup also has complications for the accuracy assessment. Thus, instead of computing accurate ground truth from the measurements from high-end equipment directly near the test receiver, a number of other ways were used to determine the ground truth.
During the first real-time test on the A13 freeway, a 5-centimeter accurate road infrastructure map from Rijkswaterstaat was used as previously mentioned. This comparison was done both visually and numerically.
For our next experiment, we selected a recently constructed parking lot with a simple, neat rectangular layout. By surveying the corners of the rectangle and using the repetitive pattern, a schematic drawing of the parking lot was made, and used to evaluate the positioning performance in a visual manner. The car was first driven over the lined-up parking spaces in a lengthwise manner, circling round at each end of the parking lot, and changing lanes once each lap at the same point. Then the car was driven along the edges of the rows of parking spaces to and fro over the parking lot.
SF-PPP positions were obtained live in the vehicle while driving. The raw (single-frequency) observations of this experiment were also post-processed with the RTKLib software package using the nearby permanent DLF1 station at the TU Delft GNSS observatory on a very short baseline (less than 1 kilometer). The ambiguity-fixed results could then be used to also numerically assess the SF-PPP positioning performance.
For the test on the train, again the network RTK GPS solution provided the ground truth positions. Two antennas were mounted along the centerline of the carriage at a fixed offset from each other: a patch antenna for the single-frequency receiver and a geodetic antenna for the ground truth. With this known offset, and the direction of motion, the ground truth position for the single-frequency receiver was obtained.
The ground-truth positions, either in the European Terrestrial Reference System (ETRS) 89 (from NETPOS or our own survey) or in the local national reference frame Rijksdriehoeksmeting (National Triangulation System) / Normaal Amsterdams Peil (Amsterdam Ordnance Datum) or RD/NAP, have been transformed into ITRF2008, to allow for comparison with the SF-PPP positions.
Computational Performance, Data Rates
The real-time software was used under the 64-bit Windows 8.1 operating system on a moderately fast laptop with i5-4200U CPU running at 1.60 GHz. The software consists of uncompiled Matlab R2014b scripts and functions using timer objects to repeatedly read in new observations, corrections and ephemerides, and to update the position computation. The software can run with data arriving at about 20 Hz in the current state on this platform, but was used with 5-Hz data because of limitations of the receiver to provide raw data and to prevent any overrun. It should be noted that only a few obvious potential computational bottlenecks were targeted; the software was not optimized for efficiency.
The RT SF-PPP implementation relies on a 3G mobile Internet connection for a number of data products. The ionosphere map, which is a predicted product (24 hours ahead), comes as a 200-kilobyte file (and 5 kilobytes for the associated differential code biases), which covers the globe and is valid for 24 hours. The file contains 13 maps at 2-hour intervals, between which interpolation in time is required.
Spatial interpolation is also required for the ionosphere pierce point of each satellite signal, between the grid points in the map (at intervals of 5 degrees in longitude and 2.5 degrees in latitude). The satellite orbit/position corrections (every 60 seconds) and satellite clock corrections (every 10 seconds) are retrieved over the Internet using the Ntrip protocol by means of the Bundesamt für Kartographie und Geodäsie (BKG) Ntrip Client (BNC), which passes these on to Matlab.
The data-rate used by this correction stream is about 1 kilobit per second. The corrections are applied to the broadcast ephemerides (in quasi-Keplerian-element form), which are therefore also required. These satellite ephemerides can be extracted by the GPS receiver itself (from the GPS navigation message), but in our implementation are also collected via Ntrip for convenience only, with a bandwidth consumption of 6 kilobits per second. Note that, much like the software implementation itself, the data stream has not been optimized for any particular bandwidth limitation. For instance, orbit and clock corrections are needed only for those satellites in view, and hence transmitting the data for all satellites of the constellation is not needed.
Results
In this section, we present the results of our tests, followed in the next section with a discussion of important common factors affecting accuracy and continuity of RT SF-PPP.
Road-Test A13 Freeway (100 Laps). Under different conditions, we collected a large amount of data with a van, driving repeatedly the same 5-kilometer stretch of road on the A13 freeway from Rotterdam to Delft. The test amounted to almost a full day of driving.
2D histograms of the results are shown in Figure 1 with corresponding statistics in TABLE 2. Note a small bias in the cross-track direction. The total number of position solutions was 2.0 × 10⁵.
Road-Test A13 Freeway (Real Time). The results of the real-time freeway road test are shown in FIGURE 2. The different lanes used by the vehicle are clearly visible in the figure. The number of GPS satellites is indicated by the color bar. Shown is the Delft-Zuid / TU Delft exit of the A13 freeway, roughly a 300 × 300 meter area, taken from the Digitaal Topografisch Bestand (DTB) of Rijkswaterstaat. Note that only the cross-track performance can be assessed in this manner, but fortunately this is exactly the performance aspect that is most interesting for the target application of lane identification. Note also that if the vehicle was not driving exactly in the middle of the lane, which to some extent is unavoidable, this effect cannot be separated from the positioning errors.

The 95-percent error southbound and northbound is 0.65 meters and 0.58 meters respectively, in the cross-track direction.
Road-Test Parking Lot. FIGURE 3 shows an aerial photograph (left) and schematic drawing (right) of the 3M company parking lot in Delft showing measured positions and driven tracks. The lines in red and yellow represent the measured tracks while driving the same loop over the parking lot again and again (more than 60 times in total), and the purple lines show the track while driving around and following the parking space boundaries with the left front wheel of the test vehicle (4 laps). These lines show both the SF-PPP position error and the driver error. The white parking spaces are each 2 meters wide.

The position errors in local north, east and up directions for part of the first dynamic session, of about 4.5 laps, of the 3M parking lot experiment (lane change 1) are shown in the upper panel of FIGURE 4. We see a clear periodic signal as well as a bias in each direction. The driving direction gives an approximation of the heading (shown in the bottom panel), which confirms that the periodic signal coincides with the driven laps.

The figure shows that the errors in the position solution are on the order of 0.2 meters, and consist of a bias in each of the three directions and a periodic signal with a period equal to the lap-time (confirmed by the driving direction of the vehicle). Since the bias does not depend on the orientation of the vehicle, and given the slow variation over time, the most likely cause is a residual ionosphere error or errors in the satellite products. The repeating pattern, on the other hand, is most probably related to multipath or near-field effects related to the vehicle antenna.
Rail-Test Amersfoort to Simpelveld. The train carriage with the GPS antennas installed was pulled by a 1955-built diesel-electric locomotive. A trip of more than 200 kilometers was made, over the main Intercity Network of Nederlandse Spoorwegen (NS) / ProRail (Dutch Railways). Only the last 20 kilometers were on a local line to a historic railway station.
The overhead power line (about 1 meter above the GPS antennas) and portals seem to have no impact on the SF-PPP positioning performance. An example of the positioning accuracy is shown in FIGURE 5. The figure shows position error scatter for an almost 20-kilometer stretch of nearly straight east-west track through rural and forest areas (Weert to Roermond). The time span of the data is 10 minutes, and the data rate was 5 Hz. SF-PPP positions were compared with NETPOS network RTK GPS solutions. Generally, eight satellites were received and used in the SF-PPP solution. The corresponding error statistics are presented in TABLE 3.


A heavy steel-construction bridge along the route at the River Lek near Culemborg, 15 kilometers south of Utrecht, was found to degrade positioning performance considerably. The heavy steel construction of the bridge hampers reception of GPS satellite signals. The positioning performance on the bridge is shown in FIGURE 6. The computed SF-PPP trajectory overlaid on a Google Earth aerial photograph is shown on the left.

From the positions, one can clearly see the train driving straight on the right-hand track (going south) on the ramp onto the bridge, and on the ramp down from the bridge. However, on the bridge itself, position solutions show considerably larger variations of up to 8 meters. The image shows a 250-meter stretch of the track. Also, the number of satellites available, and used in the position solution, drops considerably (indicated by the color bar) while the train is on the bridge. On the right of the figure at the top, the SF-PPP positions in local east-north coordinates are shown along with a straight line between the first and last epochs, representing the assumed straight track. The plot at bottom right shows the absolute cross-track offset of the position solutions with respect to the straight line, as a function of time, over 250 5-Hz epochs.
Analysis
Two factors significantly affect the performance of our tests: the number of satellites available and the continuity and latency of the corrections.
Number of Satellites. As can be expected, the SF-PPP position accuracy depends to a large extent on the number of satellites used to compute the solution. For the third test, the road-test in the 3M parking lot, the three-dimensional position error (SF-PPP versus RTK GPS) is shown as a boxplot in FIGURE 7 in which various accuracy measures are plotted as a function of the number of satellites for the second and longest dynamic part of the test (lane change 2), consisting of about 12,000 epochs of data. During this session, the available number of satellites varied between 10 and 12. This number was reduced artificially by increasing the elevation mask angle to 15 and to 30 degrees. The red lines show the medians, the boxes show the 25th and 75th percentiles, the dashed lines cover all data points not considered outliers, and outliers are plotted with red plus signs. The graph shows a clear improvement going from six to seven or more satellites.

PPP Correction-Stream Outages. To determine the optimal approach to an interruption in the correction data stream, we studied the variation of the corrections over time. Suppose we lose reception of the correction stream at epoch 0, and we keep using the last-received corrections (simply hold onto them). Then the change in values can be interpreted as the additional error introduced in the positioning algorithm by the outage on the mobile link. The effect is not catastrophic. Only after about 200 seconds do the additional satellite clock errors grow to the decimeter level. The position errors remain even smaller.
However, one might wonder whether this can be improved further by performing a linear extrapolation of the corrections, for example, using a number of previous epochs. We looked at what would happen in this case if 5 minutes of previous data are used. For the clock errors, there is no real benefit — the errors only grow larger. But the position errors do remain smaller during the first 5 minutes of extrapolation. After that time, the errors are larger than those without the linear extrapolation (just holding onto the last corrections). The effect of increasing the order of the polynomial extrapolation was also considered. The polynomials of different order outperform each other at different extrapolation times, and also the number of previous epochs used for the polynomial estimation impacts this. Further optimization to reduce the satellite position errors might well be possible, but may be of marginal value, since, the extrapolated clock error is dominant and polynomial extrapolation does not improve this. Simply using the most recent corrections is thus a straightforward and acceptable approach.
Conclusions
In this article, we outlined a real-time implementation of single-frequency GPS precise point positioning. With a fairly low-cost GPS receiver and reception of a modest correction data stream, it is possible to achieve sub-meter horizontal positioning accuracy, in real-time, live in the vehicle (95-percent error of better than 1 meter). Actual results were shown from four field tests: two tests using a vehicle on a freeway, a vehicle test in a parking lot, and one test on a train.
The number of satellites used in the position solution has a big effect on the positioning performance; seven or more satellites yields a good position accuracy. And up to 5 minutes outage of the satellite position and clock corrections does not seem to pose a serious threat to SF-PPP positioning performance.
Acknowledgments
The Dynamic Lane Guidance project under which the first road test was carried out was funded by the Ministry of Infrastructure and Environment, the Province of Noord-Brabant and the Eindhoven Regional Government in the context of Brabant in-car III. This project was carried out in close cooperation with colleagues in the Transport and Planning Department at TU Delft.
We acknowledge the provision of the Real-Time Clock Estimation (RETICLE) satellite clock products by André Hauschild at DLR for several of our field tests. We are also grateful for the use of the IGS Real-Time Service. Also, we acknowledge the provision of the NETPOS network RTK GPS service as ground truth by Lennard Huisman of Kadaster, the Dutch Land Registry and Mapping Agency. Colleague Hans van der Marel analyzed the NETPOS RTK-GPS solution of the train test. Colleagues of the TU Delft Railway Engineering Department offered the opportunity to carry out the test on the train trip from Amersfoort to Simpelveld.
Manufacturers
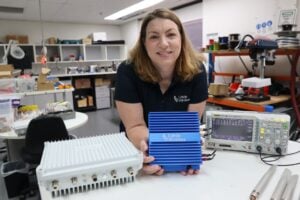
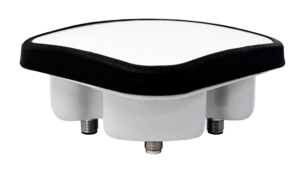
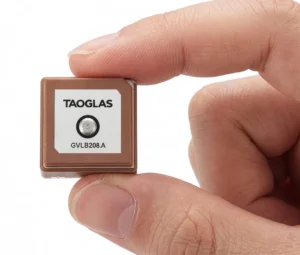
The vehicle receivers used for the tests were u-blox AG TIM LP and 7P modules in evaluation kits fed by a Tri-M Technologies Inc. Big Brother SM-66 or Taoglas Dominator AA.161 antenna. A Trimble Navigation R7 receiver with a Zephyr Geodetic antenna was used to establish ground truth for some tests.
PETER DE BAKKER is a researcher in the Faculty of Civil Engineering and Geosciences at Delft University of Technology (TU Delft). He recently finished his Ph.D. dissertation on user algorithms for GNSS precise point positioning, and is working on localization for automotive applications, including autonomous vehicles.
CHRISTIAN TIBERIUS is an associate professor in the Faculty of Civil Engineering and Geosciences at TU Delft. He has been involved in GNSS positioning and navigation research since 1991, currently with an emphasis on data quality control, satellite-based augmentation and precise point positioning.
Further Reading
• Earlier Work on Single-Frequency Precise Point Positioning
“Lane Identification with Real Time Single Frequency Precise Point Positioning: A Kinematic Trial” by R.J.P. Van Bree, P.J. Buist, C.C.J.M. Tiberius, B. van Arem and V.L. Knoop in Proceedings of ION GNSS 2011, the 24th International Technical Meeting of the Satellite Division of The Institute of Navigation Portland, Ore., Sept. 19–23, 2011, pp. 314–323.
“Real Time Satellite Clocks in Single Frequency Precise Point Positioning” by R.J.P. Van Bree, C.C.J.M. Tiberius and A. Hauschild in Proceedings of ION GNSS 2009, the 22nd International Technical Meeting of the Satellite Division of The Institute of Navigation, Savannah, Ga., Sept. 22–25, 2009, pp. 2400–2414.
“Single-frequency Precise Point Positioning with Optimal Filtering” by A.Q. Le and C. C. J. M. Tiberius in GPS Solutions, Vol. 11, No. 1, 2007, pp. 61–69, doi: 10.1007/s10291-006-0033-9.
• Single- vs. Dual-Frequency Precise Point Positioning
“GNSS Solutions: Single- versus Dual-Frequency Precise Point Positioning” by H. van der Marel and P.F. de Bakker with M. Petovello in Inside GNSS, Vol. 7, No. 4, July/Aug. 2012, pp. 30–35.
• Precise Point Positioning: Overviews and Issues
Improved Convergence for GNSS Precise Point Positioning by S. Banville, Ph.D. dissertation, Department of Geodesy and Geomatics Engineering, Technical Report No. 294, University of New Brunswick, Fredericton, New Brunswick, Canada. Recipient of The Institute of Navigation 2014 Bradford W. Parkinson Award.
“Precise Point Positioning: A Powerful Technique with a Promising Future” by S.B. Bisnath and Y. Gao in GPS World, Vol. 20, No. 4, April 2009, pp. 43–50.
• Real-Time Data Streaming
“Ntrip – Networked Transport of RTCM via Internet Protocol” by the GNSS Data Center of the Bundesamt für Kartographie und Geodäsie (BKG), the German Federal Agency for Cartography and Geodesy.
“Coming Soon: The International GNSS Real-Time Service” by M. Caissy, L. Argrotis, G. Weber, M. Hernandez-Pajares and U. Hugentobler in GPS World, Vol. 23, No. 6, June 2012, pp. 52–58.
• Miscellaneous
“Digitaal Topografisch Bestand” (in Dutch) by Rijkswaterstaat, the Dutch Ministry of Infrastructure and the Environment.
“Development of the Low-cost RTK-GPS Receiver with an Open Source Program Package RTKLIB” by T. Takasu and A. Yasuda in Proceedings of the International Symposium on GPS/GNSS, Jeju, Korea, November 4–6, 2009.
“Variations of Box Plots” by R. McGill, J.W. Tukey and W.A. Larsen in The American Statistician, Vol. 32, No. 1, Feb. 1978, pp. 12–16, doi: 10.2307/2683468.