No audio available for this content.
Integrated with images and dense distance measurements from a range camera using active illumination, inertial navigation produces real-time results on a tablet computer. Experiments demonstrate that the system provides good positioning and mapping performance in a range of indoor environments, including darkness and smoke.

Positioning and mapping abilities for indoor environments can speed search and rescue, keep firefighters from getting lost, and help a commander track soldiers searching a building. Accurate results from these environments increase personnel safety in unknown, dangerous environments and can also facilitate remote control of unmanned ground vehicles (UGVs).
A new iteration in the Chameleon family of positioning systems that we have developed, the Tiger Chameleon, combines an inertial measurement unit (IMU) with an active camera that measures distances using modulated laser light. This type of camera provides dense and accurate distance measurements, and has the added advantage of working well in darkness.
The main goal of the Chameleon systems is to provide soldiers and first responders with position information and approximate overview maps, preferably without affecting their operating procedure. The Tiger Chameleon does not require any infrastructure, such as visual markers or radio beacons. Positioning and mapping results are computed in real time based on data from the IMU and the active camera, and wirelessly transmitted to a visualization interface running on a tablet computer or smartphone.
Sensors and Hardware
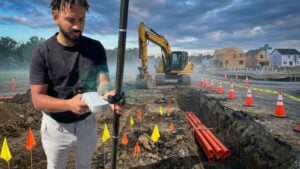
In initial experiments, the Tiger Chameleon’s components are enclosed in a wooden box which can be mounted on a soldier’s tactical vest. FIGURE 1 gives a schematic overview.

Image Sensor. The image sensor includes two cameras: one high-resolution visual camera and one lower-resolution depth sensor. The latter uses a modulated near-infrared (NIR) light source and a special type of sensor to measure distance. Essentially, each pixel is divided into two halves, one of which integrates incoming light when the light source is turned on, while the other integrates light when it is turned off. If the light hitting a pixel has bounced off an object located close to the sensor, almost all light will be integrated by the first half of the pixel. If the object is moved further away, it will take longer for the light to return, and hence more light will be integrated by the second half of the pixel.
In addition to measuring the depth of the scene, the NIR camera provides an intensity image where the value of each pixel is determined by the total amount of light hitting the two pixel halves. The intensity image is similar to an ordinary visual image. Unlike an image from a passive camera, however, it is largely independent of ambient light, since it mostly measures reflected light from the illuminator. Hence, both the intensity and the depth images are available even in completely dark or obscured environments. Coming from the same sensor, the intensity and depth images are perfectly registered to each other. Images are produced at 30 Hz.
The high-resolution visual camera is not used by this prototype.
Inertial Sensor. The IMU provides calibrated measurements of acceleration and angular velocity at 400 Hz. The sensor itself does not perform any inertial navigation or attitude estimation. Since we fuse the inertial data with image-based features for navigation, however, the basic acceleration and angular velocity measurements are more useful in our application than pre-filtered position or orientation estimates. The sensor measures acceleration up to 5 g, and angular velocity up to 1,000 degrees/ second, since relatively high-dynamic motion is common in the intended application. The IMU also contains a magnetometer and a barometer, but these are not used since air pressure and magnetic fields are not always reliable for navigation indoors.
Algorithms
The positioning algorithm is based on EKF-SLAM, simultaneous localization and mapping (SLAM) implemented as an extended Kalman filter (EKF). The EKF fuses data from the IMU (three-dimensional accelerations and angular velocities) with image data, according to the uncertainties of the different types of data. It tracks the system state, composed of the position, velocity and orientation of the system, the IMU biases (slowly varying offsets in the acceleration and angular velocity measurements), and the positions of a number of landmarks in the images.
The landmarks are points observed in the images, which are used for navigation. These are chosen to be points which are recognizable, well-defined and stationary. This essentially means that it should be easy to recognize a landmark when it appears in a new image, and that the image coordinates of a landmark should be stable in both the horizontal and vertical directions. Thus, corner points are good candidates for landmarks, while line structures in an image are not. The world coordinates of a landmark should not change over time.
Theoretically, it would be possible to navigate using only IMU data. The system orientation would then be obtained by integrating the angular velocities, while the acceleration (after removing the effect of gravity) would be integrated to obtain the velocity, and double-integrated to obtain the position. Due to the high bias variability and noise of micro-electro-mechanical systems (MEMS) IMUs — the only type sufficiently small, lightweight and inexpensive for use by soldiers or firefighters — this only works for a few seconds before the accumulated error grows to an unacceptable level.
In theory, it would also be possible to navigate using only landmarks extracted from the image sequence. This, however, is also problematic in practice. If the system moves too rapidly, successive images may not share any landmarks at all. Additionally, no landmarks are found in featureless environments. This causes image-only navigation to fail in many realistic scenarios.
By fusing the inertial data with landmark observations, we alleviate most of these problems. While the IMU provides good short-term performance, the image data provides long- term stability. Hence, the IMU can overcome short periods with few or no landmarks, while the image data limits the error growth of the system (assuming that the periods without landmarks are not too long).

Algorithm Flow. In the data fusion FIGURE 2, potential landmarks are found in an intensity image from the NIR camera, by identifying points that can be well localized. The potential landmarks are found by using an interest-point detector. The visual appearance of a point is represented using the SIFT descriptor. The distance to each potential landmark is determined by using the depth image. Potential landmarks are matched to landmarks that are already tracked by the system, based on a combination of their visual appearance and their coordinates (the spatial distance between the observed points and the predicted image coordinates of the tracked points, and the difference between the predicted and the observed distance to the points).
IMU data is used to predict where tracked points should appear. Pure inertial navigation is relatively accurate in the time interval between successive frames (approximately 30 images per second are processed). Observed points, which match tracked points, are used to update the estimated state (position, velocity and so on). Tracking is started for observed points, which do not match any tracked points unless a predetermined number (30 in the current implementation) of points are already tracked. Points that are tracked but not observed in a number of consecutive image pairs are removed from the point tracker.
Each depth image corresponds to a local point cloud, where points lie on the surfaces of objects in the scene observed by the camera. The intensity of each point can be obtained from the corresponding intensity image. Since the position and orientation of the system are estimated by the SLAM algorithm, these local point clouds can be transformed into a common coordinate system, thereby creating a large point cloud representing the entire environment along the trajectory of the system. This point cloud can either be used as a three dimensional model, or projected onto a horizontal plane for an overview map.
Implementation
To accurately predict where tracked landmarks will appear in a new image, it is important to synchronize the image stream and the inertial data. While the IMU handles this well (it can either trigger, or timestamp the trigger pulse from, a camera), synchronization is potentially difficult when working with consumer hardware such as the the one selected for this prototype. However, while the camera cannot be triggered externally, it does perform internal synchronization between the NIR and the visual cameras, which both run at 30 Hz. (It is unknown to us which camera triggers the other, or if there is a third piece of hardware which triggers both cameras.) Using an oscilloscope, we found that a pulse train at 30 Hz can be accessed at a solder point inside the camera.
This 30 Hz signal is active whenever the camera is powered. It is therefore not possible to synchronize the camera to the IMU using only this signal, since it only indicates that an arbitrary image was acquired at the time of each pulse. To synchronize the sensors, we need to know exactly when each specific image was acquired. Thus, a synchronization pulse, which is only transmitted when image acquisition is enabled, is needed. In addition to the 30-Hz pulse train, a signal that is high only when the cameras are active can also be found inside the camera. We perform a logical AND to combine these signals into the desired synchronization pulse.
We obtain the timestamp of each image from the IMU by connecting the combined synchronization signal to its synchronization input. There is a small delay between the first pulse in the combined signal and the time when the first image is acquired. This was measured by recording inertial data and images while first keeping the system stationary, and then rotating it quickly. Manual inspection of the image sequence and the angular velocities reveals that the delay is approximately 8 intra-frame intervals (0.267 s).
Software. The recording and analysis software are written in C++, and run in real time under Linux. It makes heavy use of multi-threading in order to optimize the computational performance of the algorithms.
The software is divided into two subsystems: one that communicates with the sensors, and one that performs the image analysis and SLAM computations. These subsystems communicate using the Robot Operating System (ROS). There is also a subsystem (or “node” in ROS terminology) for playing back previously recorded data. The playback node publishes the same type of messages as the sensor node, and these nodes can therefore be used interchangeably.

FIGURE 3 shows how data flows through the analysis node. Queues buffer data between the different threads. Incoming images from the recording or playback node are initially put in the image queues for feature extraction. After feature extraction (where the depth image is used to determine the distance to each observed landmark), the resulting image features are stored in the potential landmarks queue. The features are then processed by the EKF-SLAM thread, which also reads from the IMU data queue. The resulting pose estimates (positions and orientations) are sent to the communication module, where they are transmitted to the visualization device. In parallel with this, images are also processed by the rectification and mapping threads, where they are paired with poses from the SLAM algorithm to create map data. The map data is also sent to the communication module. A number of efficient libraries exist for low-level image processing, and also for the linear algebra computations needed by the EKF. The following libraries are used:
- VLFeat for finding landmarks and extracting SIFT features
- OpenCV for image rectification
- Armadillo for high-level math operations
- ROS for communication between the subsystems
- A modified version of IAI Kinect2 for ROS communication with the sensor
- A slightly modified version of Libfreenect for low-level communication with the sensor.
Evaluation
The prototype has been evaluated in a number of experiments, in cooperation with soldiers and first responders. Three experiments are reported here. All were performed during soldier or smoke-diver training. Mapping results in the figures are presented along with estimated soldier and smoke-diver trajectories (bluegreen lines) from the positioning system. The results are evaluated based on the mapping, since the ground truth trajectories are unknown. Positioning is still evaluated implicitly, as inaccurate positioning would cause poor mapping performance such as double or skewed walls, since the mapping is based on estimated camera positions and orientations.
Searching for Biological Hazards. Collection of evidence at a crime scene is commonly performed using a camera, taking numerous pictures of the scene from different positions at different angles and distances. To keep track of all images and where they were captured is cumbersome work, which can easily be automated by integrating the camera with a positioning system.
Several variations of this experiment were performed, all in cooperation with soldiers from the Swedish Armed Forces National CBRN Defence Centre. The main task was to document different areas in the building, to be able to handle any encountered dangerous biological objects in a safe way, and to preserve evidence for later use. If a dangerous object is found, the mapping result from the system could be used to plan how the object should be taken care of and what exit path the soldiers could use to minimize the time being exposed to a dangerous environment.

The photo above an image from the NIR sensor in the prototype system, captured in the building while two soldiers searched for biological hazards. A map estimated by the prototype system appears in FIGURE 4.
For evaluation of the mapping performance, a part of this building was also measured using a highly accurate scanning laser system. FIGURE 5 shows the point clouds from both the Tiger Chameleon (black) and the scanning laser (white). Locally (within a room), the errors are less than 5 centimeters. Over larger distances, heading drift causes larger errors, which are visible as slightly misaligned walls. In this case, there are no significant errors. (The structures that are only visible in the laser scanner data are parts of the ceiling and its supporting beams, which were never observed by the positioning system.)

Searching a Building. A group of eight soldiers searched and cleared a part of a building. This required them to move more quickly than in the first experiment, since the building could not be assumed to be safe. Additionally, one or several soldiers often appears in the field of view of the positioning system. We requested the soldier carrying the system to avoid walking too close behind another soldier, to avoid covering the entire field of view. Apart from this, the soldiers were asked to act as they normally would during the exercise.

Positioning and mapping results are shown in FIGURE 6. The map is slightly distorted due to errors in the estimated heading, but still good enough to understand the building layout. The distortion is visible as double walls in the top part of the figure. We believe that most of the errors were caused by the system not being entirely stationary during the sensor initialization at the start of the experiment. No reference map is available for this location. We also performed experiments where the soldiers fired their weapons near the positioning system. This affects the IMU, severely degrading the measurements of acceleration and angular velocity. Hence, the positioning system was not able to present correct position or mapping estimates in these cases.
Smoke-Diver Searching a Building. The smoke-diver experiments indicated how the positioning system performs when used in a smoke-filled environment. During the experiments, the system was exposed to different levels of smoke.

Positioning and mapping results from the experiment are shown in FIGURE 7, while FIGURE 8 shows the result from the Tiger Chameleon (black) overlaid on reference data from the laser scanner (white). The estimated map is in good agreement with the reference map data, although a heading error affects some walls (bottom right).
All smoke densities affect the image quality from the NIR sensor, since the active illumination is reflected by the smoke particles. In light smoke, the main effect is that the smoke appears as spurious points in the point clouds, eventually ending up in the map, while positioning performance is not significantly affected. Most spurious points were removed by adding the constraint that points very close to the camera are not added to the map, although smoke still causes more interior points to be visible in Figure 7 than in the other maps. The effect on the positioning system increases with the smoke density. In thick smoke, most illumination is reflected, effectively rendering positioning impossible using this type of image sensor.
Discussion

The current positioning algorithm works well, but over longer experiments its position estimate slowly drifts away from the true position. This is caused by both the inertial sensors and the landmark-based positioning updating the current position estimate only relative to recent estimates. Since landmarks are discarded after not being observed for a short time, no loop closures ever occur. Saving landmarks could solve this in specific scenarios, where landmarks are re-observed after long times, but doing so would increase the computational complexity considerably. Additionally, for landmark-based loop closure to work well, the landmarks would need to be reobserved from approximately the same position, further limiting the scenarios where this could be expected to work well. Ongoing work aims instead at closing loops by recognizing the scene geometry, as represented by the point-cloud models.
When using active illumination, the mapping performance does not depend on texture on walls and other surfaces. This is an advantage compared to passive stereo cameras. Further, active illumination enables positioning and mapping in darkness.
Comparison to Other Systems. The prototype system was not constructed with the purpose of creating high accuracy models of small, detailed environments. Rather, the purpose was to enable soldiers to create approximate maps of entire buildings with minimal impact on their operating procedure. Detailed reconstruction is handled better by other systems, but these have the disadvantage of requiring the user to survey the environment systematically, adapting his or her work methods to the sensor.
SWaP-C and Hardware. Size, weight, power and cost (SWaP-C) are constant issues for soldier equipment. Ideally, the equipment should be disposable: cheap enough to throw away after being used just once, or fit into some type of disposable container.
Since this is a prototype system built for research and demonstration purposes, components with convenient electrical and programming interfaces have been selected. Therefore, the system is considerably larger than a final end-user product would be. In such a product, sensors and computation hardware with similar performance, but considerable smaller size, lower weight and lower power consumption, would be selected instead. Such components are commercially available.
Outdoor/Indoor Use. Though this positioning system is primarily designed for indoor use, seamless transition between indoor and outdoor environments is desired. Ongoing work aims at integrating a GPS receiver to achieve this. Adding GPS would also enable positioning in a georeferenced coordinate system; currently, all results are presented in a local coordinate system defined by the start position and orientation. This requires an algorithm for making robust decisions regarding when GPS measurements should be considered reliable.
Visualization Interface. The visualization interface currently runs on a tablet computer, and is therefore most useful to a commander or group leader who remotely tracks the soldier or firefighter. By adapting the interface to the smaller screen of a smartphone, it would be possible to also give the user access to position and map information.
An important advantage of automatic mapping, according to several users, is the ability to detect hidden spaces in buildings. In certain types of operations, the ability to document a building before leaving it is also considered valuable.
Real-Time Implementation. An interesting aspect of performing all computations in real time is that it effectively precludes tuning of algorithm parameters to individual data sets. When analyzing data offline, this is far too common, and typically overestimates the performance of the system or algorithms. All experiments reported in this article have been performed without any such parameter tuning.
Autonomous or Remote-Controlled Platforms. The system can also be used on an unmanned ground or
aerial vehicle (UGV or UAV). This could be suitable for searching buildings too dangerous to enter. The system would continuously distribute its position and mapping estimates while traveling through the building. This could provide soldiers and rescue teams with a preview of the unknown environment and a possibility to plan their operations in a safer way. Many robotics projects use ROS, which makes integration of the Tiger Chameleon relatively straightforward.
Firing of Weapons. During some experiments, we discovered that the measures of acceleration and angular velocity are affected by close-range gunfire. Relatively long segments of measurements are affected, which makes interpolation of missing values difficult. During these periods, it may be possible to disregard the inertial measurements, resorting to only image-based positioning.
Summary
This prototype system for indoor positioning and mapping, based on inertial navigation and distance measurements using active illumination, does not require any infrastructure or prior knowledge about the environment. The system has been designed for experiments and demonstration purposes, and has been shown to provide good performance in real time in a variety of different indoor environments when carried by potential end users.
Manufacturers
The Tiger Chameleon consists of a Microsoft Kinect v2, an Xsens MTi-10 IMU and a small computer with a mobile Intel i7 CPU.
Acknowledgments
The authors thank the soldiers from South Scania Regiment (P7), Sweden, who participated in the initial tests with the prototype. We also thank the smoke divers from Södertörn Fire Prevention Association, Sweden, for carrying the prototype in smoke-filled environments. Also, we really appreciated the feedback from the Swedish Armed Forces National CBRN Defence Centre during the prototype development. Finally, we acknowledge Hannes Ovrén at Linköping University, Sweden, for improving the Libfreenect library.
The material in this article is based on a technical paper presented at ION/IEEE PLANS 2016.